Triangular plotting and diagnostics for FESOM2 + command line utility similar to fdiag using plotting suite of Patrick.Scholz@awi.de (former fesom2/view_pscholz folder). Data reading got updated to xarray, plotting got updated to cartopy, actually works well for python3.7
In moment only possible by source files using pip:
1st. clone respository:
git clone https://github.com/patrickscholz/tripyview2nd. install using pip:
cd tripyview
pip install -e .-
hslice- plot horizontal slices for ocean variable (compute depth and time averages) -
hslice_np- plot horizontal slices for ocean variable north polar stereographic projection -
hslice_sp- plot horizontal slices for ocean variable south polar stereographic projection -
hslice_clim- plot horizontal slices of temperature, salinity and density climatology (compute depth and time averages) -
hslice_clim_np- plot horizontal slices of temperature, salinity and density climatology in north polar stereographic projection -
hslice_clim_sp- plot horizontal slices of temperature, salinity and density climatology in south polar stereographic projection -
hovm- plot hovmöller diagramms for 3d ocean varaible over depth and time averaged over specific region that defined by shapefile (see. tripyview/shapefiles/...) -
hovm_clim- plot hovmöller diagramms for temperature, salinity and density climatology over depth and time averaged over specific region that defined by shapefile (see. tripyview/shapefiles/...) -
transect- plot point wise transects of 3d ocean varíables -
transect_clim- plot point wise transects of 3d temperature, salinity and density climatology -
transect_transp- plot volume transport through arbitrary transects (model accurate transport) -
transect_transp_t- plot time-series of volume transport through arbitrary transects (model accurate transport) -
transect_zmean- plot zonally averaged transects of 3d ocean varíables -
transect_zmean_clim- plot zonally averaged transects of 3d temperature, salinity and density climatology -
vprofile- plot lines for averaged vertical profile of 3d ocean varíables -
vprofile_clim- plot lines for averaged vertical profile of 3d temperature, salinity and density climatology -
var_t- plots time series of of globally averaged 2d and 3d variables
zmoc- plot meridional overturning circulation from vertical velocity (based on latitudinal binning), Globally, for the: Atlantic(amoc), Atlantic+Arctic(aamoc), Pacific(pmoc), Pacific+Indian Ocean(ipmoc) and Indian Ocean(imoc)


-
zmoc_t- plot timeseries of atlantic meridional overturning circulation at specific latitudes (default: which_lats: [26, 40, 'max']) -
dmoc- plot meridional overturning circulation in density coordinates using FESOM2 density MOC diagnostics (graditues goes to Dmitry.Sidorenko@awi.de), Globally, for the: Atlantic(amoc), Atlantic+Arctic(aamoc), Pacific(pmoc), Pacific+Indian Ocean(ipmoc) and Indian Ocean(imoc) -
dmoc_srf- plot surface transformation of meridional overturning circulation in density coordinates -
dmoc_inner- plot inner transformation of meridional overturning circulation in density coordinates


dmoc_z,dmoc_srf_z,dmoc_inner_z- plot meridional overturning circulation in density coordinates back into z-coordinate space


-
dmoc_wdiap- plot diapycnal velocity for specific water-class -
dmoc_srfcbflx- plot surface buoyancy flux transformation for specific water-class -
dmoc_t- plot timeseries of atlantic meridional overturning circulation in density coordinates at specific latitudes (default: which_lats: [26, 55, 'max']) -
hbarstreamf- plot horizontal barotropic streamfunction -
ghflx- plots global meridional heat flux computed from surface heatfluxes fh -
mhflx- plots global meridional heat flux computed from the the turbulent fluxes tempv, tempu
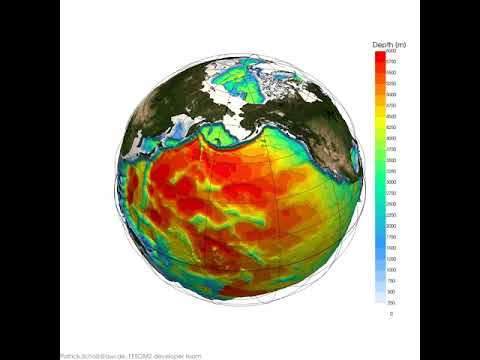
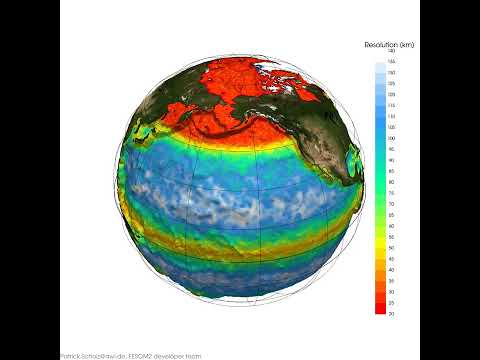
3dsphere- plot 3d model of FESOM grid with variables using pyvista interface
![]()
make 3D animations
diagrun <workflowfile.yml> - command line diagnostics similar to fdiag (fdiag, served as a
template, graditues go to Nikolay.Koldunov@awi.de), creates html files with linked plots
If you use the package please give the package or the author some credit.