| 📌 Checkpoints | Status |
|---|---|
| ◾ Datacollection | ✔️ |
| ◾ Initial feature engineering | ✔️ |
| ◾ Visualization | ✔️ |
| ◾ Implement basic model | ✔️ |
| ◾ Initial predictions | ✔️ |
| ◾ Multi-feature predictions | 🕤 |
| ◾ Improved visualization | 🕤 |
| ◾ Create transformer model | ✔️ |
| ◾ Convert transformer to numerical model | 🕤 |
| ◾ Start build dash app | 🕤 |
| ◾ Deploy dash app | 🕤 |
| ◾ Real-time update | 🕤 |
Hobby project in NLP with numerical time-series - stock market prediction based on the adjusted closing price, monthly gain and correlation among different industry-based companies from self build transformer model. Collecting the data (using pandas datareader from yahoo finance). Initial predictions are done on just the adjusted closing price with a LSTM model with a linear bottleneck. The loss being used is MSE:
.
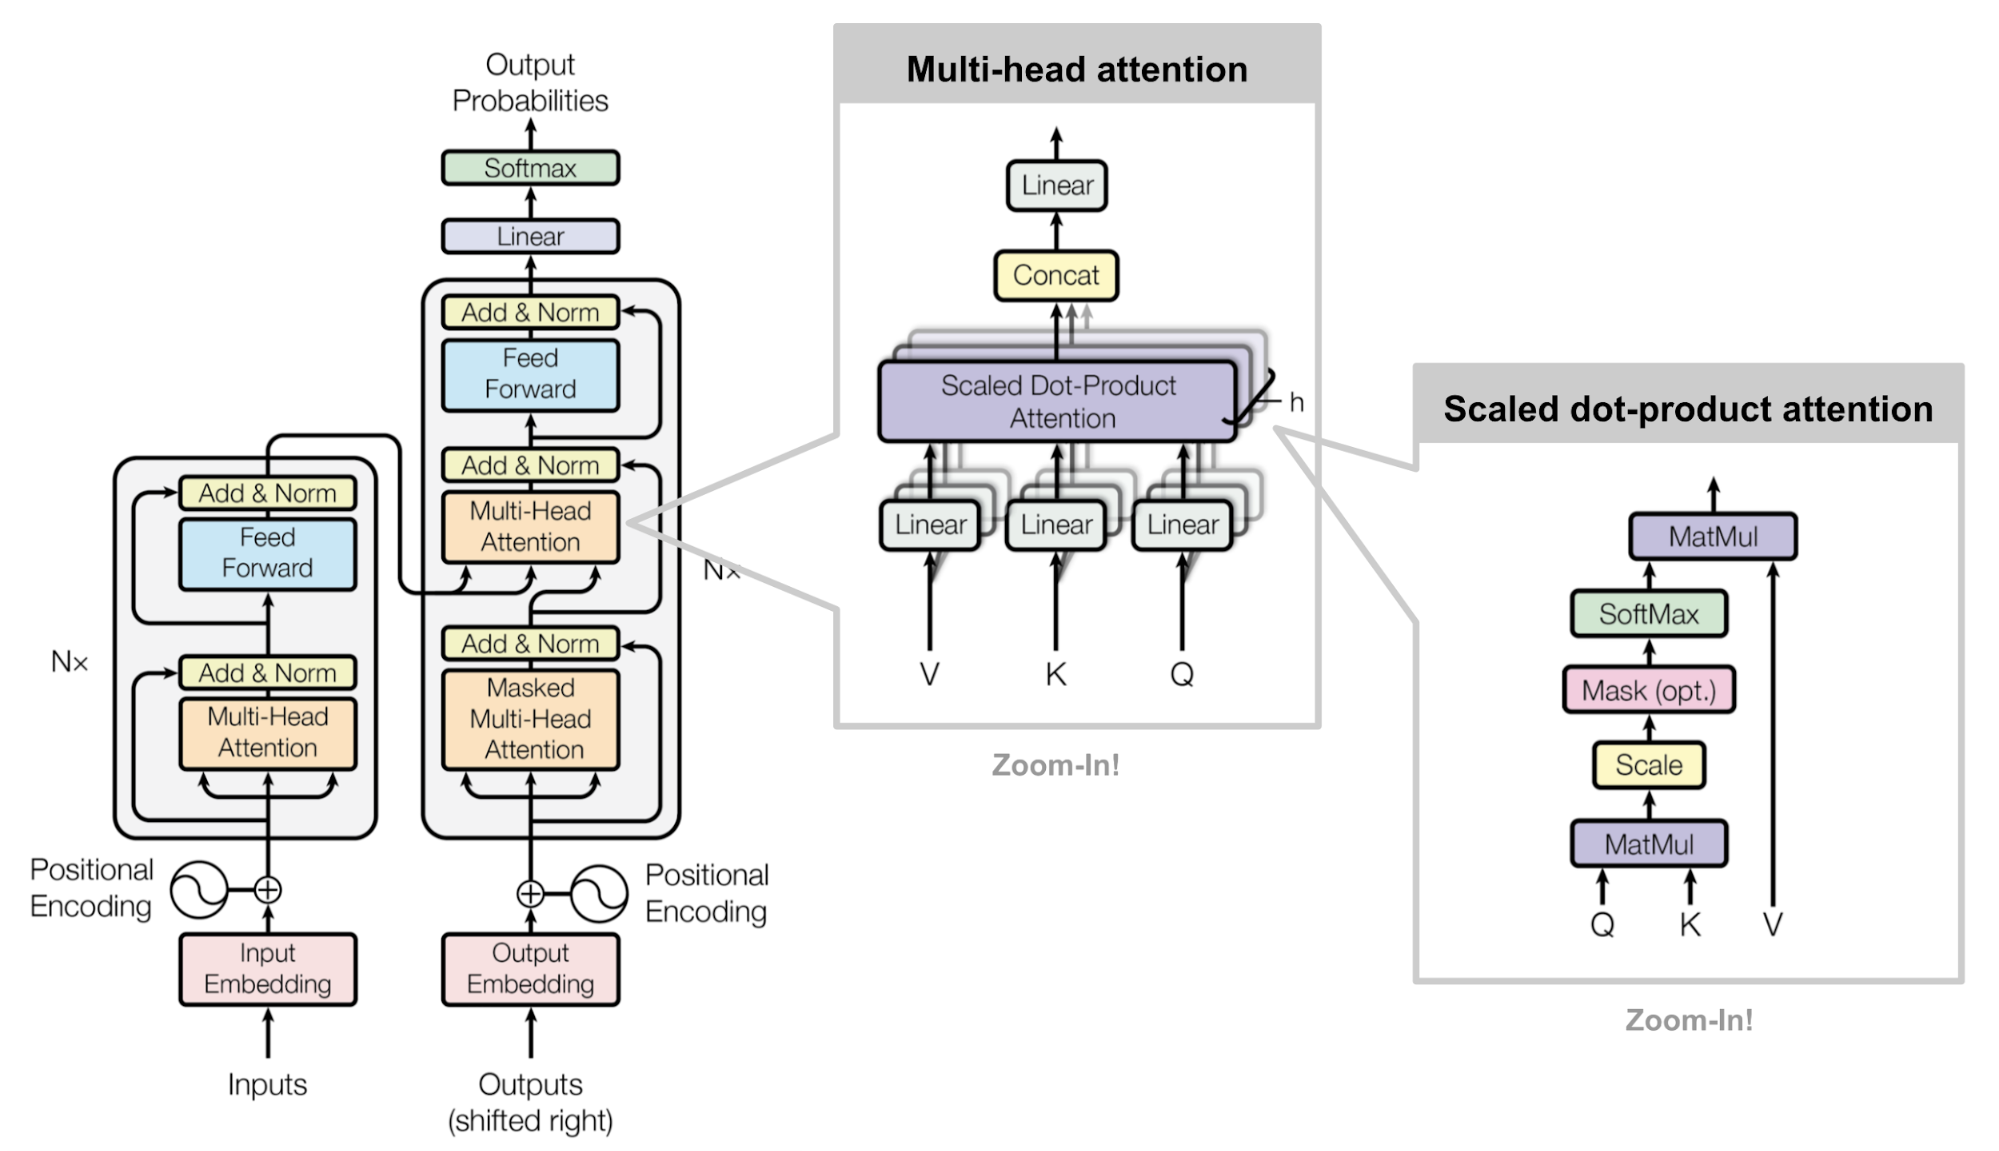
Aim of the project is to build a transformer model from scratch and comparing its result with the LSTM network and doing so by ensemble results from different multi-feature predictions from different time periods.
Collection and visualization of data from arbitrary timespan:


Using plotly for python to make interactive plots in order to zoom and move in the graph:


Also, comparison of arbitrary number of stocks and visualize the correlation between them are also available:


The intial predictions on the adjusted closing price after implemented a LSTM model built from the Keras framework:
